Top 5 Forex Chart Patterns Every Trader Should Know
Forex chart patterns are essential tools for predicting market behavior. They help traders identify potential breakouts, reversals, and trend continuations. Mastering these patterns gives you an edge in technical analysis and decision-making.
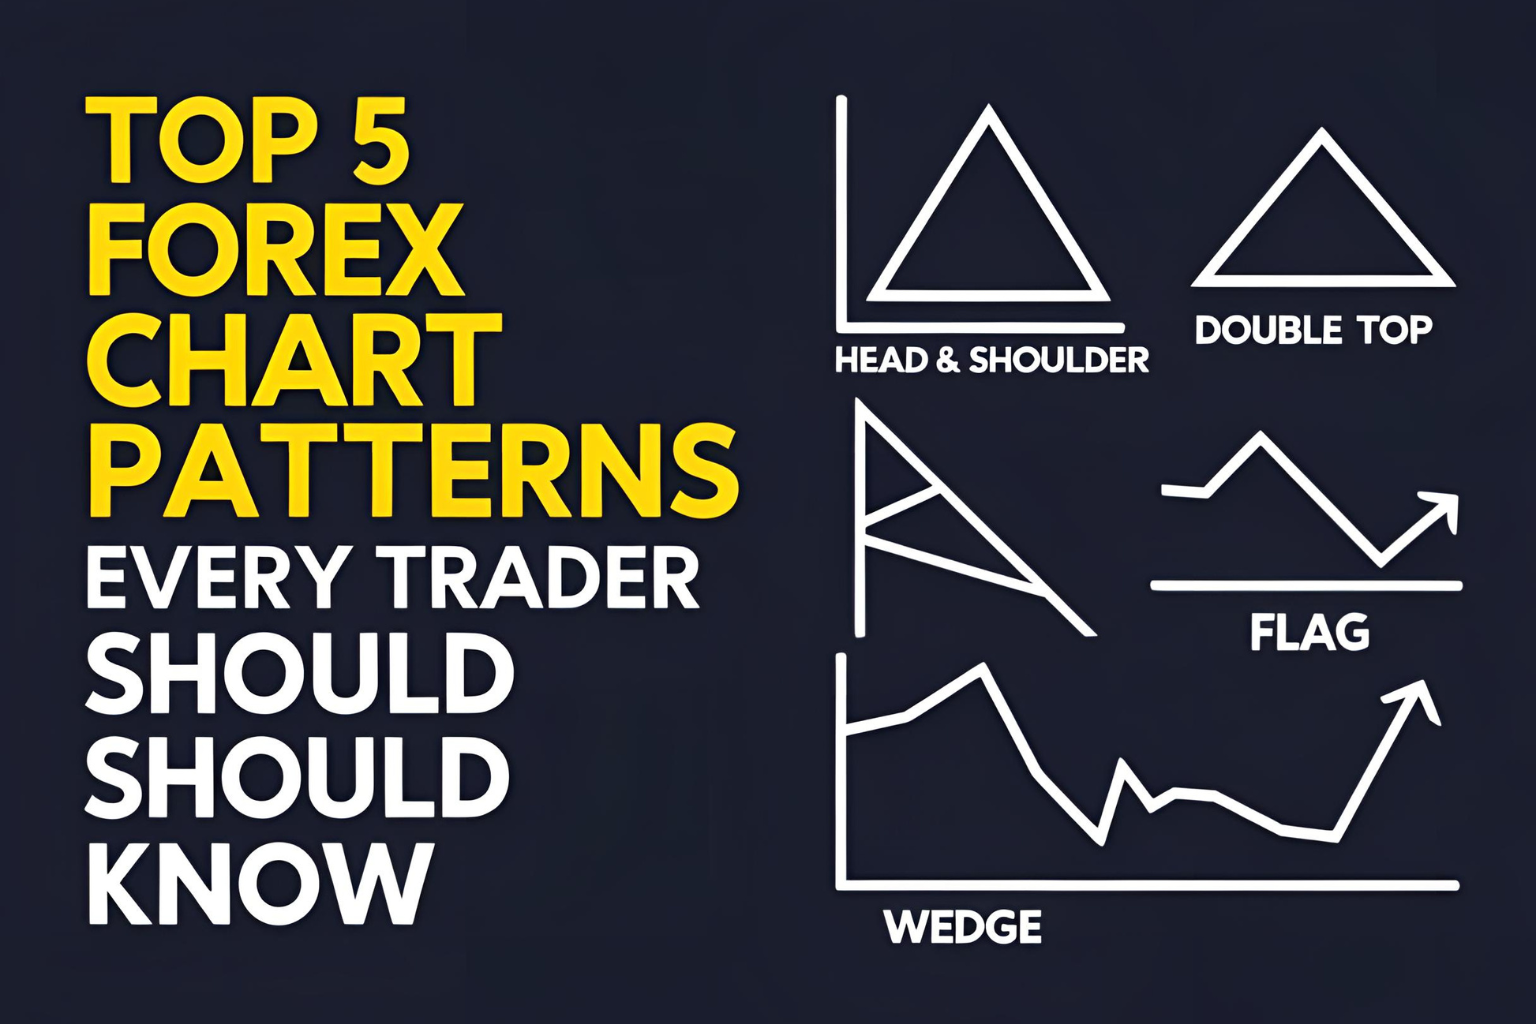
Here are the top 5 chart patterns every forex trader should know.
1. Head and Shoulders Pattern
This reversal pattern appears at the top of an uptrend and signals a potential trend change.
- Structure: Left shoulder, head (higher peak), right shoulder.
- Signal: Bearish reversal.
- Strategy: Enter a short position after price breaks the neckline.
2. Double Top and Double Bottom
These are strong reversal patterns.
- Double Top: Two peaks near the same level, signaling bearish reversal.
- Double Bottom: Two troughs at a similar level, indicating bullish reversal.
- Strategy: Enter after confirmation with volume and neckline break.
3. Ascending and Descending Triangles
These continuation patterns suggest the current trend will persist.
- Ascending Triangle: Higher lows, resistance at the top — bullish breakout likely.
- Descending Triangle: Lower highs, support at the bottom — bearish breakout expected.
- Strategy: Trade breakout direction after price closes beyond triangle boundary.
4. Symmetrical Triangle
Indicates a period of consolidation before a breakout in either direction.
- Structure: Converging trendlines with lower highs and higher lows.
- Signal: Breakout direction confirms next trend.
- Strategy: Wait for volume confirmation after breakout.
5. Flag and Pennant Patterns
Short-term continuation patterns during strong trends.
- Flag: Rectangular consolidation area.
- Pennant: Small symmetrical triangle that forms after a sharp move.
- Strategy: Trade in the direction of the original trend after breakout.
Why Chart Patterns Matter
- Help identify high-probability trade setups
- Improve entry and exit timing
- Enhance overall trading confidence
- Work well with support/resistance and indicators
Final Thoughts
Chart patterns are powerful when used correctly. Combine them with sound risk management, volume analysis, and confirmation tools to improve your accuracy. Start by practicing on demo accounts and reviewing historical chart data.
FAQs
1. Are forex chart patterns reliable?
Yes, especially when confirmed with volume and price action. No pattern is 100% accurate, but many offer high-probability setups.
2. What’s the most accurate chart pattern?
The Head and Shoulders pattern is one of the most reliable reversal indicators when properly identified.
3. Can beginners use chart patterns?
Absolutely. Start with simple patterns like double tops and triangles before moving to complex ones.
4. How do I practice reading chart patterns?
Use platforms like TradingView to study past data and simulate trades using identified patterns.
5. Do chart patterns work for all currency pairs?
Yes, chart patterns can be applied across all forex pairs, though effectiveness may vary with volatility and market conditions.