How to Identify Support and Resistance on Forex Charts
Support and resistance levels are foundational concepts in forex trading. These zones help traders pinpoint where price may stall, reverse, or break out — offering valuable insights for placing trades.
In this guide, we’ll explore what support and resistance are, why they matter, and how to identify them with confidence.
What Is Support and Resistance?
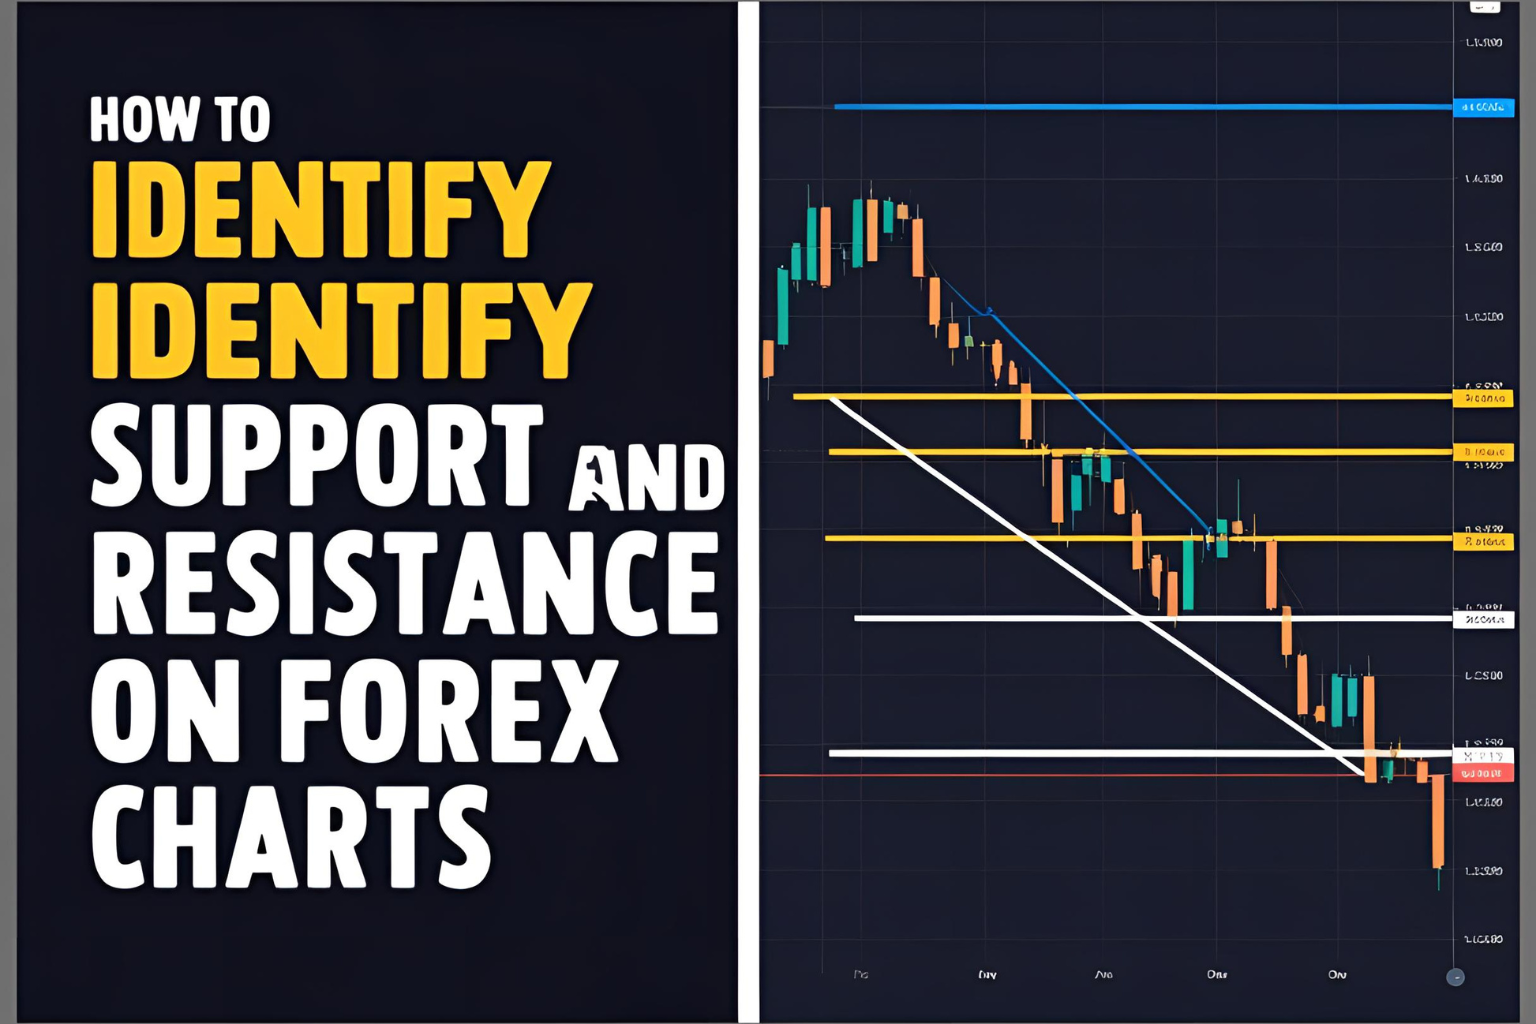
- Support: A price level where a currency pair tends to stop falling and may reverse upward. It acts like a “floor.”
- Resistance: A level where the price typically stops rising and might reverse downward. It acts like a “ceiling.”
These levels are not fixed numbers but zones where buying or selling pressure builds.
Why They Matter in Forex Trading
- Help define entry and exit points
- Used to set stop-loss and take-profit orders
- Provide context for trend reversals and breakouts
- Critical for building price action strategies
How to Identify Support and Resistance
1. Look for Repeated Reversal Points
Check where the price has bounced or dropped multiple times on historical charts. These zones often act as future support or resistance.
2. Use Line Charts for Simplicity
Switching to a line chart removes candlestick noise and helps you see clean swing highs and lows.
3. Draw Horizontal Lines or Zones
Use drawing tools to mark out zones—not exact price points. These zones may span several pips wide.
4. Use Round Numbers
Forex pairs often react near round numbers like 1.1000, 1.2500, etc. These psychological levels act as natural barriers.
5. Look at Timeframe Confluence
Support/resistance seen on multiple timeframes (H1, H4, D1) is more powerful than on just one.
Tools to Help Spot These Levels
- TradingView drawing tools
- MT4 horizontal line feature
- Auto SR indicators (optional)
- Fibonacci retracement (for deeper analysis)
Common Mistakes to Avoid
- Treating SR levels as exact points instead of zones
- Ignoring volume confirmation or candlestick rejection patterns
- Using too many lines that clutter the chart
Final Thoughts
Support and resistance are not just lines — they reflect real market psychology. When used correctly, they can dramatically improve your trade timing and risk management. Combine them with candlestick patterns or indicators for stronger results.
FAQs
1. Are support and resistance levels always accurate?
No level is perfect, but these zones often attract significant price reaction. Use confirmation techniques for better results.
2. How do I draw support/resistance on TradingView?
Use the horizontal line tool or rectangle tool to mark zones where price has historically reacted.
3. Should I use support/resistance alone?
They work best when combined with other tools like trendlines, RSI, or price action patterns.
4. What timeframe is best for drawing support and resistance?
Daily and H4 charts are great for long-term levels, while H1 and M15 work well for intraday trading.
5. Can support become resistance and vice versa?
Yes, when price breaks a level, it often “flips” — support becomes resistance or resistance becomes support.
