How to Spot Breakouts on Forex Charts
Breakouts in the forex market can lead to strong and profitable price movements, especially when confirmed by volume and chart structure. However, distinguishing between a true breakout and a false one is crucial for successful trading.
In this guide, you’ll learn how to identify breakout opportunities on forex charts and how to avoid common mistakes.
What Is a Breakout in Forex?
A breakout occurs when the price moves beyond a defined level of support or resistance, often leading to increased volatility and trend continuation or reversal.
Breakouts typically happen:
- After periods of consolidation
- Near horizontal levels (support/resistance)
- Out of chart patterns (triangles, channels, rectangles)
How to Identify Breakout Setups
1. Find Consolidation Zones
Look for areas where price has moved sideways within a range. The longer the consolidation, the more powerful the breakout can be.
2. Draw Clear Support and Resistance Levels
Use horizontal lines or zones where price has reversed multiple times.
3. Watch for Volume Increase
A breakout with increased trading volume is more likely to be valid.
4. Look for Candlestick Confirmation
Strong candles closing above resistance or below support suggest follow-through.
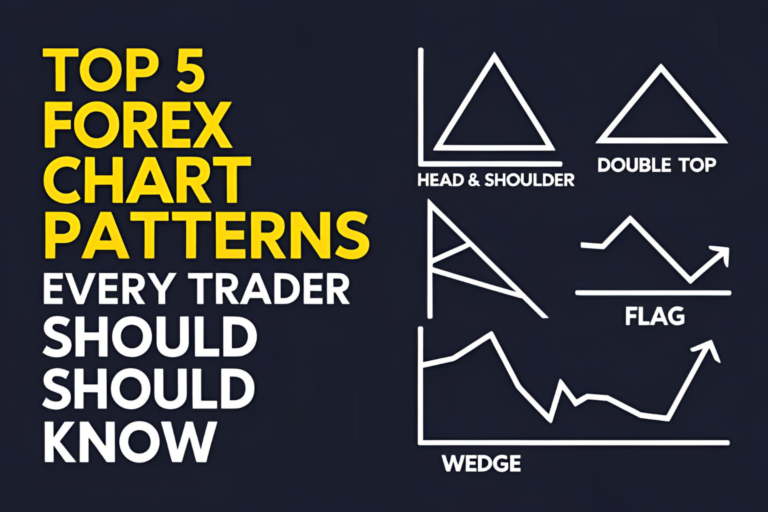
Common Chart Patterns That Signal Breakouts
- Ascending Triangle: Bullish breakout expected
- Descending Triangle: Bearish breakout likely
- Symmetrical Triangle: Can break in either direction
- Flag and Pennant: Continuation patterns after a strong price move
- Range Box: Horizontal consolidation followed by directional breakout
How to Confirm a Breakout
- Wait for candle close beyond the breakout level
- Look for retest of the breakout zone followed by continuation
- Use RSI or MACD divergence as added confirmation
- Avoid entering during news releases that may trigger fake breakouts
False Breakouts: What to Watch For
- Price spikes and immediately reverses
- Lack of volume during the breakout
- Wicks that pierce levels but do not close beyond them
Solution: Wait for confirmation and avoid trading the initial breakout blindly.
Trading a Breakout Strategy Example
- Identify a consolidation zone on EUR/USD 1-hour chart
- Draw horizontal resistance at 1.0800
- Price breaks above with strong bullish candle and increased volume
- Wait for a retest of 1.0800 as support
- Enter long position on bounce with stop-loss below the new support
Final Thoughts
Spotting breakouts can be a high-reward strategy when done with discipline and confirmation. Avoid rushing into trades and always assess volume, candlestick structure, and previous price action. With experience, your ability to spot genuine breakout opportunities will improve.
FAQs
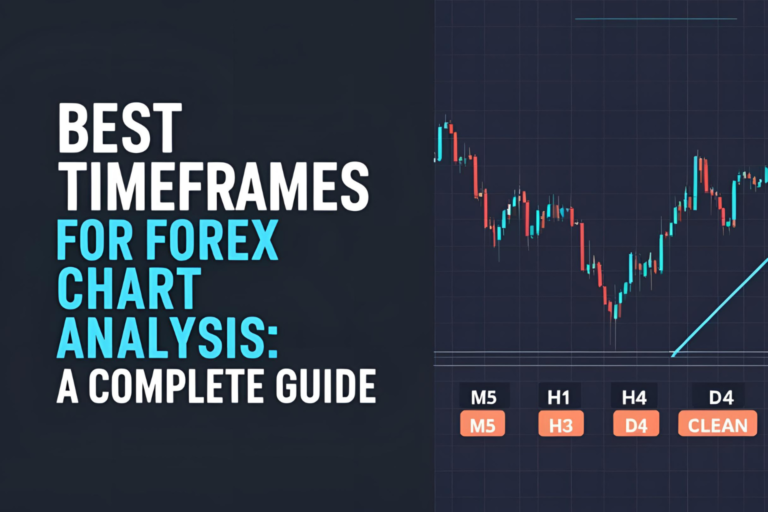
1. What is the best timeframe to spot breakouts?
Breakouts on higher timeframes like H1 or H4 are more reliable than those on M5 or M15.
2. How do I avoid false breakouts?
Wait for candle close confirmation, look for volume increase, and use retests before entering.
3. Are breakout trades high risk?
They can be if not managed properly. Always use stop-loss and confirm the breakout before entry.
4. Can I use indicators to confirm breakouts?
Yes, RSI, MACD, and Bollinger Bands can help confirm breakout strength or warn of divergence.
5. Do breakouts work in all market conditions?
Breakouts are more effective during high volatility periods. They are less reliable in choppy or low-volume markets.