How to Read Forex Charts: A Beginner’s Guide
Forex trading begins with understanding how to read price charts. Whether you’re a beginner or just exploring forex markets, mastering chart reading is essential to making smart trading decisions. In this guide, we’ll walk through the basics of forex charts and how to interpret them with confidence.
What Is a Forex Chart?
A forex chart is a visual representation of the price movement of currency pairs over time. These charts display historical price data in formats like line, bar, or candlestick — helping traders analyze trends, spot patterns, and predict future price moves.
Types of Forex Charts
1. Line Chart
- Connects closing prices over a set period.
- Best for a quick overview of market direction.
2. Bar Chart
- Displays open, high, low, and close prices for each time period.
- More detailed than line charts.
3. Candlestick Chart
- Most popular chart type.
- Visually appealing with color-coded candles showing bullish or bearish movement.
Key Elements on a Forex Chart
- Price Axis (Y-axis): Shows currency price levels.
- Time Axis (X-axis): Shows the time intervals (minutes, hours, days).
- Currency Pair (e.g., EUR/USD): Indicates which currencies you’re analyzing.
- Timeframe: Charts can be set to M1, H1, D1, etc., depending on your strategy.
Basic Chart Reading Techniques
1. Identify Trends
Look for higher highs and higher lows (uptrend), or lower highs and lower lows (downtrend).
2. Spot Support and Resistance
Horizontal lines where price tends to bounce or reverse.
3. Look for Patterns
Patterns like double tops, head and shoulders, or triangles can signal potential reversals or continuations.
4. Use Indicators (Optional)
Simple indicators like Moving Averages or RSI can support your analysis.
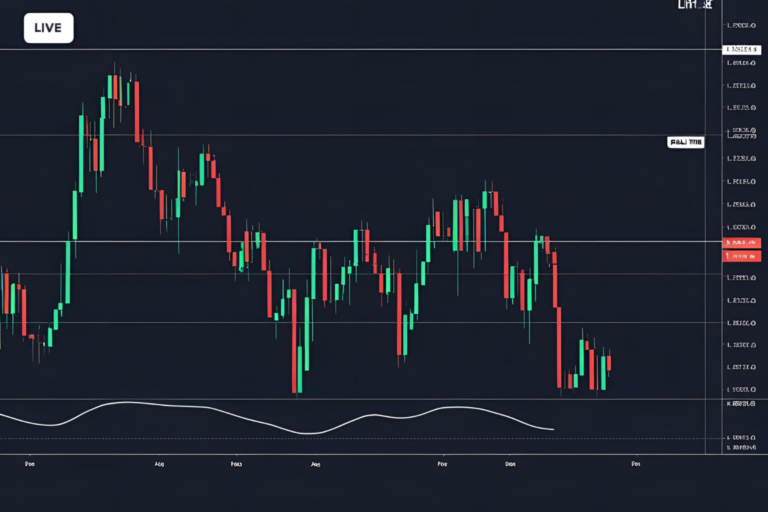
Practical Example
If you’re looking at the EUR/USD chart on a 1-hour timeframe and see a series of green candlesticks with higher highs, it may signal a short-term uptrend. You can combine this with support/resistance levels for a better entry/exit point.
Final Thoughts
Learning to read forex charts is the first step toward becoming a successful trader. As you gain experience, you’ll start to recognize patterns and interpret signals faster. Practice with demo accounts and charting tools like TradingView to build confidence.
FAQs
1. What’s the best type of forex chart for beginners?
Candlestick charts are ideal for beginners due to their visual clarity and detailed price action.
2. What timeframe should I use to analyze forex charts?
It depends on your strategy. Intraday traders may use 5-minute to 1-hour charts, while swing traders may prefer 4-hour or daily charts.
3. Can I read forex charts without indicators?
Yes, many traders rely solely on price action, support/resistance, and chart patterns without using indicators.
4. Do forex charts differ by broker or platform?
Minor differences can occur due to price feeds, but the general patterns remain the same across platforms.
5. How long does it take to get good at reading charts?
It varies by individual, but with consistent practice, most traders become proficient in a few weeks to months.