How to Analyze Forex Charts Like a Pro
Reading a forex chart is one thing. Analyzing it effectively is another. Professional-level chart analysis requires a blend of technical knowledge, pattern recognition, and decision-making discipline. In this post, you’ll learn how to analyze forex charts like a pro, even if you’re just starting out.
1. Start with the Overall Trend
Begin your analysis by determining the market direction. Look at higher timeframes (H4, Daily) to identify if the trend is up, down, or sideways. Use trendlines or moving averages to confirm.
- Uptrend: Higher highs and higher lows
- Downtrend: Lower highs and lower lows
- Range: Sideways price movement between support and resistance
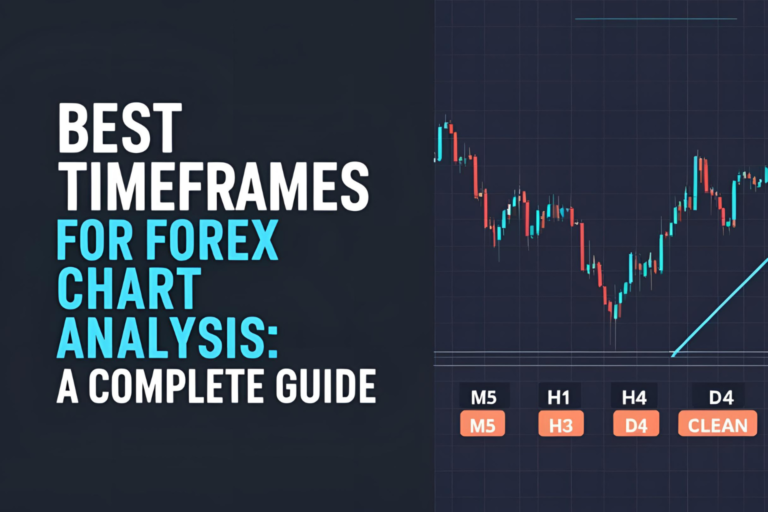
2. Use Multiple Timeframe Analysis
Cross-check trends across multiple timeframes to get a more complete view. For example:
- Use the Daily chart to understand the broader trend
- Use the H1 or M15 chart to time entries and exits
This helps avoid entering trades against the larger trend.
3. Draw Support and Resistance Levels
Mark key price zones where the market has previously reversed or stalled. These levels help:
- Identify breakout or reversal areas
- Set realistic stop-loss and take-profit levels
- Avoid trading in cluttered zones
4. Apply Technical Indicators Wisely
Indicators enhance your analysis but should not be the only factor in decision-making. Combine 2 to 3 types for balanced insight:
- Trend indicator: Moving Average or MACD
- Momentum indicator: RSI or Stochastic
- Volatility indicator: Bollinger Bands or ATR
Avoid overlapping tools that offer the same information.
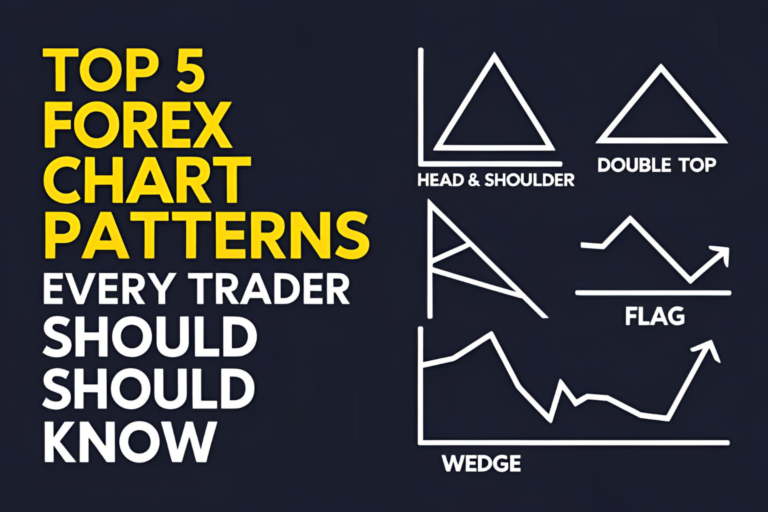
5. Recognize Price Patterns
Learn to identify classic chart patterns such as:
- Head and Shoulders
- Double Top and Double Bottom
- Flags, Pennants, and Triangles
These patterns help you anticipate future price behavior and plan entries accordingly.
6. Check for Market Context and News
Before finalizing a trade decision, consider economic events, session timings, and market sentiment. Use an economic calendar to check for scheduled news that may impact volatility.
7. Confirm with Price Action
Use candlestick formations such as pin bars, engulfing candles, or inside bars for trade confirmation. These patterns, when aligned with technical zones, can improve accuracy.
Final Thoughts
Forex chart analysis is a skill built with time and practice. By following a structured approach—starting from the trend, adding levels and indicators, and confirming with price action—you’ll make more confident and informed trading decisions.
Stay consistent, review your trades, and keep refining your method.
FAQs
1. What is the best timeframe to analyze forex charts?
There’s no single best timeframe. Use higher timeframes for trend analysis and lower ones for entries.
2. Should I use indicators or just price action?
Both can be effective. Many traders use price action for structure and indicators for confirmation.
3. How can I improve my forex analysis skills?
Study historical charts, backtest strategies, and learn from both winning and losing trades.
4. Do I need to analyze charts daily?
Yes, especially if you trade intraday or swing. Regular chart review improves decision-making.
5. Are free tools like TradingView enough for analysis?
Yes, TradingView offers more than enough for both beginner and advanced analysis.