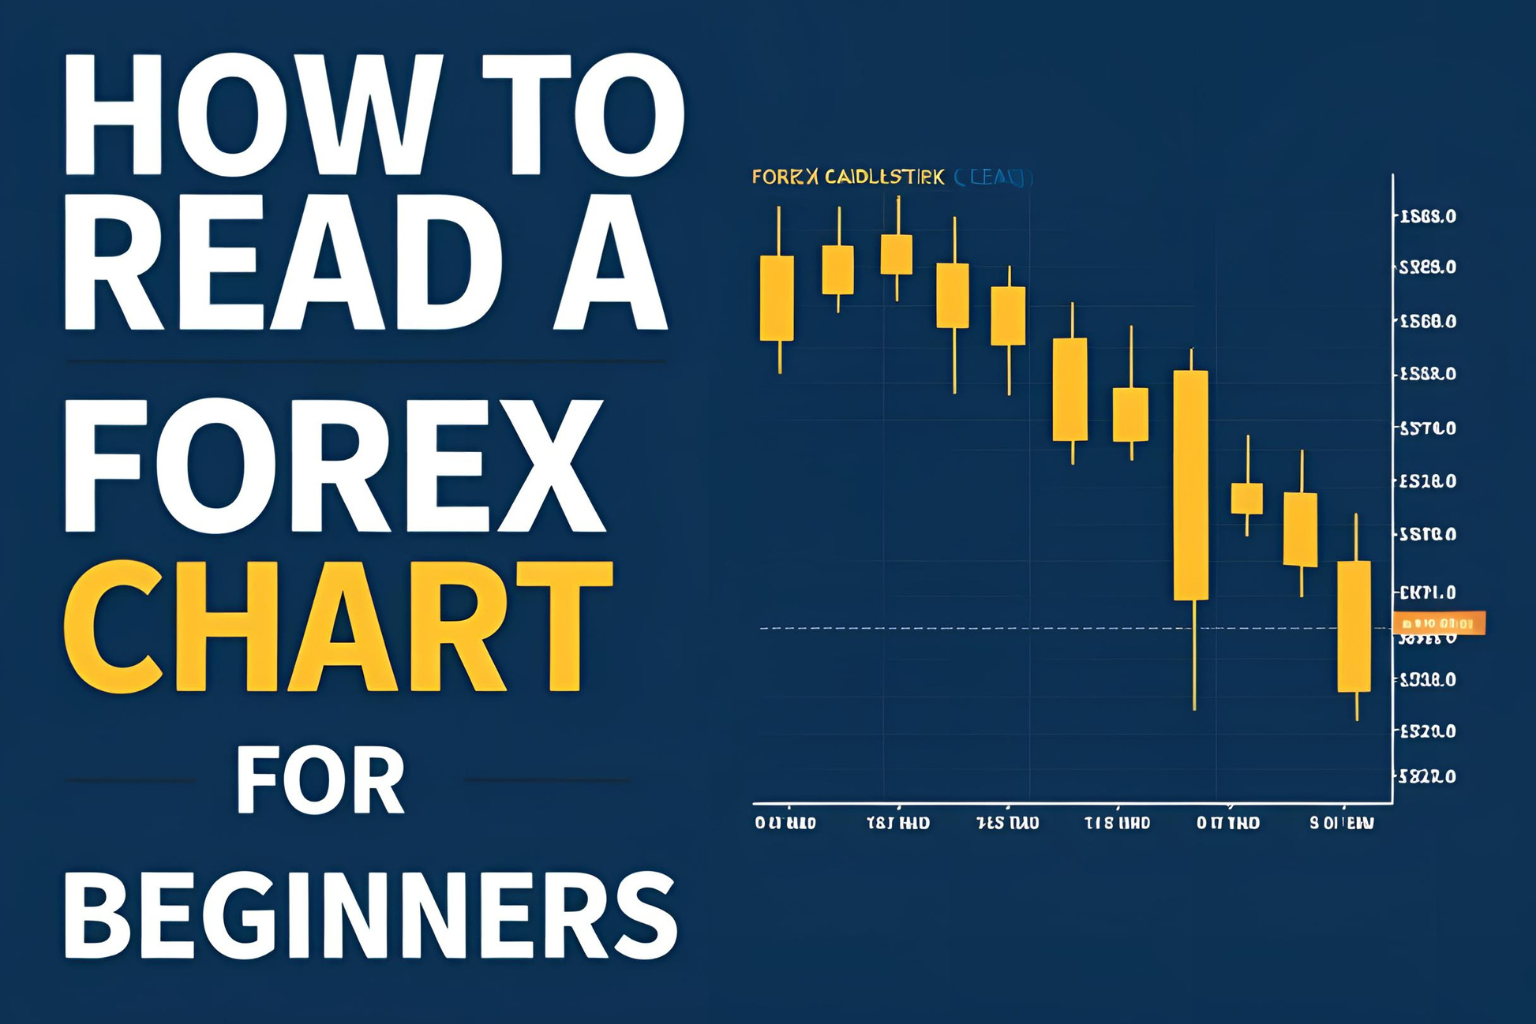
How to Read a Forex Chart for Beginners
Reading a forex chart is one of the first skills every new trader needs to master. It may seem overwhelming at first, but once you understand the basic elements, you’ll be able to analyze currency pairs more confidently and make better trading decisions.
In this beginner’s guide, we’ll walk you through the basics of forex chart reading step by step.
What Is a Forex Chart?
A forex chart displays the historical price movement of a currency pair over a selected period of time. Traders use charts to observe trends, patterns, and potential entry or exit points.
Each currency pair, such as EUR/USD or GBP/JPY, has its own chart, and you can choose different timeframes—ranging from 1 minute to 1 month.
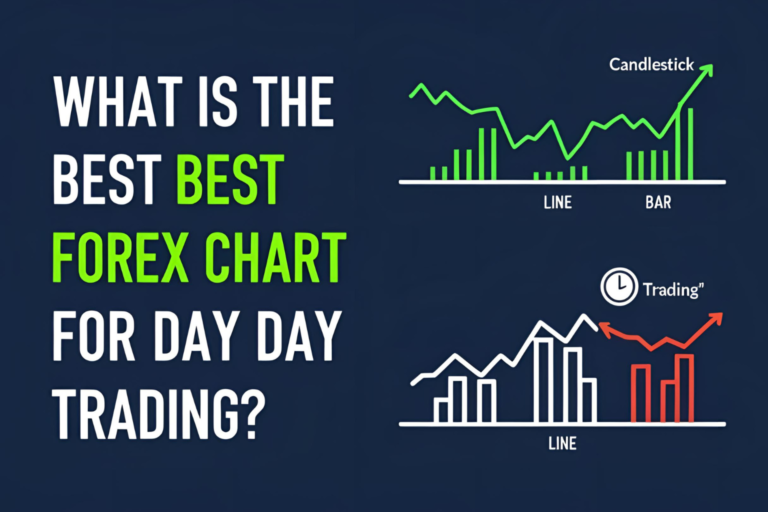
Chart Types Commonly Used
Line Chart
- Plots a line from one closing price to the next
- Easy to read and useful for spotting trends
Bar Chart
- Displays open, high, low, and close prices for each period
- Shows more detail than a line chart
Candlestick Chart
- The most popular format
- Uses color-coded candles to show market sentiment
- Helps identify bullish or bearish movements quickly
Key Elements of a Forex Chart
- Currency Pair: The asset being charted (e.g., EUR/USD)
- Timeframe: The duration of each candle (e.g., M15, H1, D1)
- Price Axis (Y-axis): Vertical scale showing price levels
- Time Axis (X-axis): Horizontal scale showing time intervals
- Volume (optional): Shows activity level, when available
Steps to Read a Forex Chart
- Identify the Trend
- Look for higher highs and higher lows in an uptrend
- Look for lower highs and lower lows in a downtrend
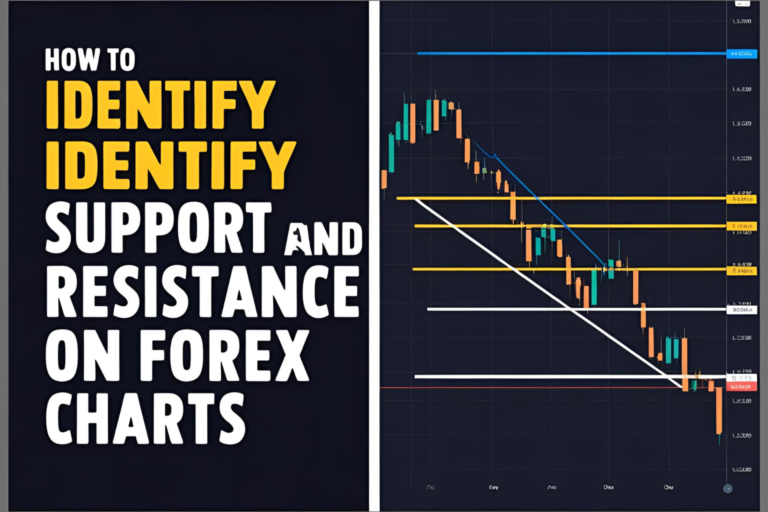
- Draw Support and Resistance Zones
- These are areas where price has reversed or paused in the past
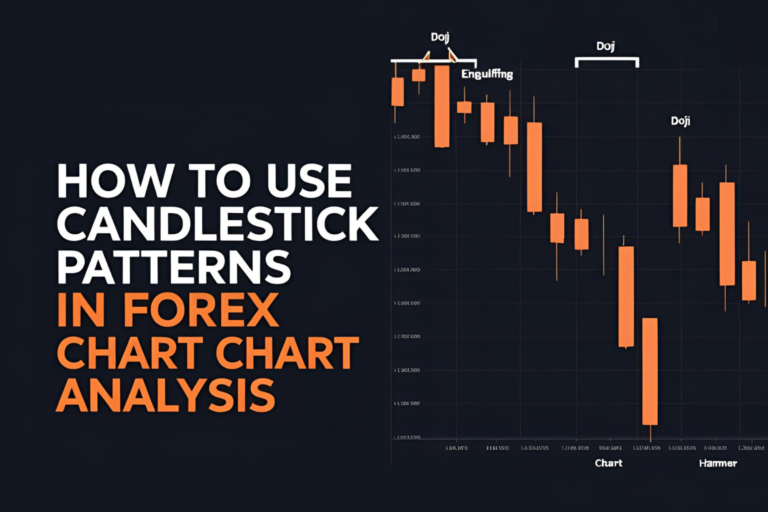
- Observe Candlestick Patterns
- Patterns like Doji, Engulfing, or Pin Bars can signal a change in direction
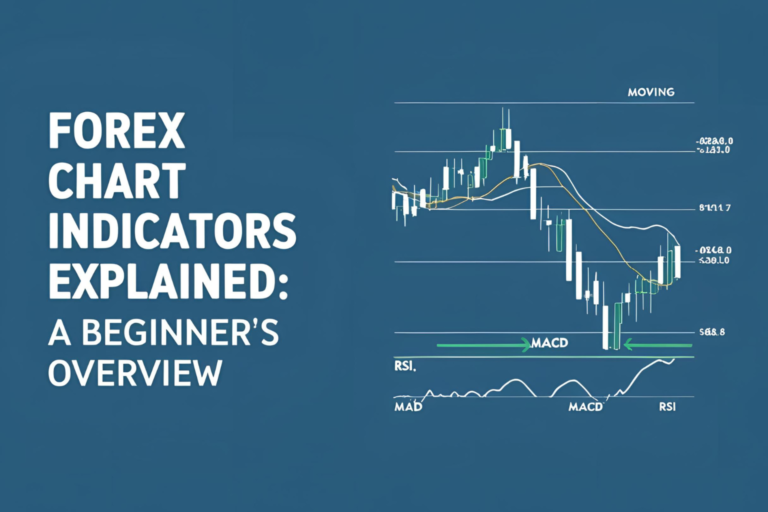
- Add Simple Indicators
- Use tools like Moving Averages or RSI to confirm what you see
Example Setup for Beginners
- 15-minute or 1-hour chart
- Add a 50-period Moving Average
- Look for candlestick patterns near support/resistance
- Confirm direction with RSI
Final Thoughts
Learning how to read a forex chart takes practice, but it is a foundational skill for all traders. Focus on mastering one chart type, use simple indicators, and practice by reviewing historical data or trading in a demo account.
Start slow, stay consistent, and always trade based on analysis—not emotion.
FAQs
1. What is the easiest forex chart type to start with?
The candlestick chart is beginner-friendly and gives a complete view of market sentiment.
2. Do I need to learn all chart types?
No. Mastering one chart type, like candlesticks, is often enough for most traders.
3. Which timeframe should a beginner use?
Start with H1 or H4 charts. They reduce market noise and offer clearer setups.
4. Is technical analysis necessary to read forex charts?
Yes, basic technical analysis helps you understand patterns, trends, and trading zones.
5. How can I practice reading forex charts?
Use free platforms like TradingView or MT4. Study historical price movements and test your observations.