Common Forex Chart Analysis Mistakes to Avoid
ven experienced traders fall into traps when analyzing forex charts. These mistakes can lead to poor trade entries, unnecessary losses, and confusion about market direction. Recognizing and avoiding these errors can significantly improve your trading results.
Here are the most common forex chart analysis mistakes and how to avoid them.
1. Overloading the Chart with Indicators
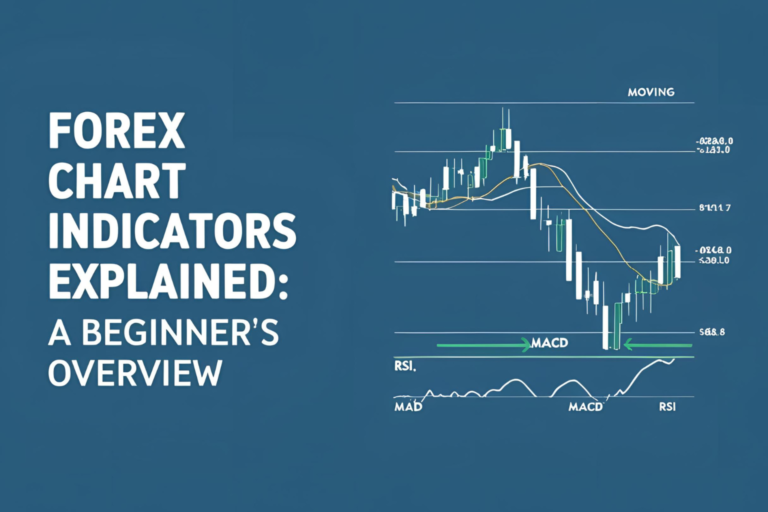
Using too many indicators can clutter your chart and create conflicting signals. It often leads to indecision and poor entries.
Solution:
Stick to two or three indicators that complement each other. For example, one for trend, one for momentum, and one for volatility.
2. Ignoring the Higher Timeframe
Analyzing trades only on a lower timeframe can lead to false signals. Traders often miss the broader market context.
Solution:
Always check the trend on the higher timeframe before trading on the lower one. This ensures your entry aligns with the market structure.
3. Misinterpreting Chart Patterns
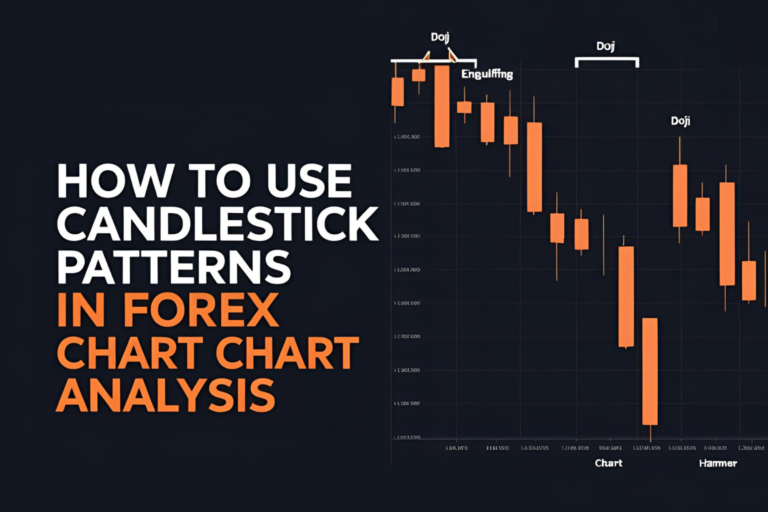
Traders may see patterns that aren’t there or trade them without confirmation.
Solution:
Look for clean, well-formed patterns and confirm with support/resistance, volume, or candle close.
4. Trading Without Support and Resistance Levels
Failing to identify key price zones often results in entering trades near turning points.
Solution:
Draw support and resistance zones on your chart before analyzing further. These levels help validate setups and avoid false entries.
5. Relying Solely on Indicators
Indicators are helpful, but they lag price action and should not be your only decision-making tool.
Solution:
Use indicators as confirmation, not for generating signals by themselves. Price action should be your primary focus.
6. Entering Trades Without Confirmation
Jumping into trades based on assumptions rather than confirmed setups leads to inconsistent results.
Solution:
Wait for candle close confirmations, retests, or confluence signals before entering.
7. Ignoring Market News and Events
Economic events can quickly invalidate technical setups.
Solution:
Check the economic calendar before trading. Avoid opening new trades during high-impact news releases.
8. Emotional or Revenge Trading
Letting emotions override your analysis often results in rapid losses and poor discipline.
Solution:
Use a written trading plan and stick to predefined rules. Review your trades objectively.
Final Thoughts
Forex chart analysis is a skill that improves over time. By avoiding these common mistakes and staying consistent with your strategy, you’ll be better positioned to make confident, data-driven trading decisions.
Keep your charts clean, respect the trend, and always trade with discipline.
FAQs
1. Why should I use fewer indicators in my analysis?
Fewer indicators reduce clutter and allow you to focus on what matters—price action and structure.
2. Can I rely only on patterns to trade forex?
Patterns can help, but they should be confirmed by key levels or indicators to be effective.
3. How do I know if I’m reading the trend wrong?
Check multiple timeframes. If the higher timeframe shows an opposite trend, reassess your analysis.
4. What’s the biggest mistake new traders make?
Overtrading and relying too heavily on indicators without understanding market context.
5. How can I practice avoiding these mistakes?
Use a demo account, keep a trading journal, and review every trade—win or lose—for patterns and improvement.
