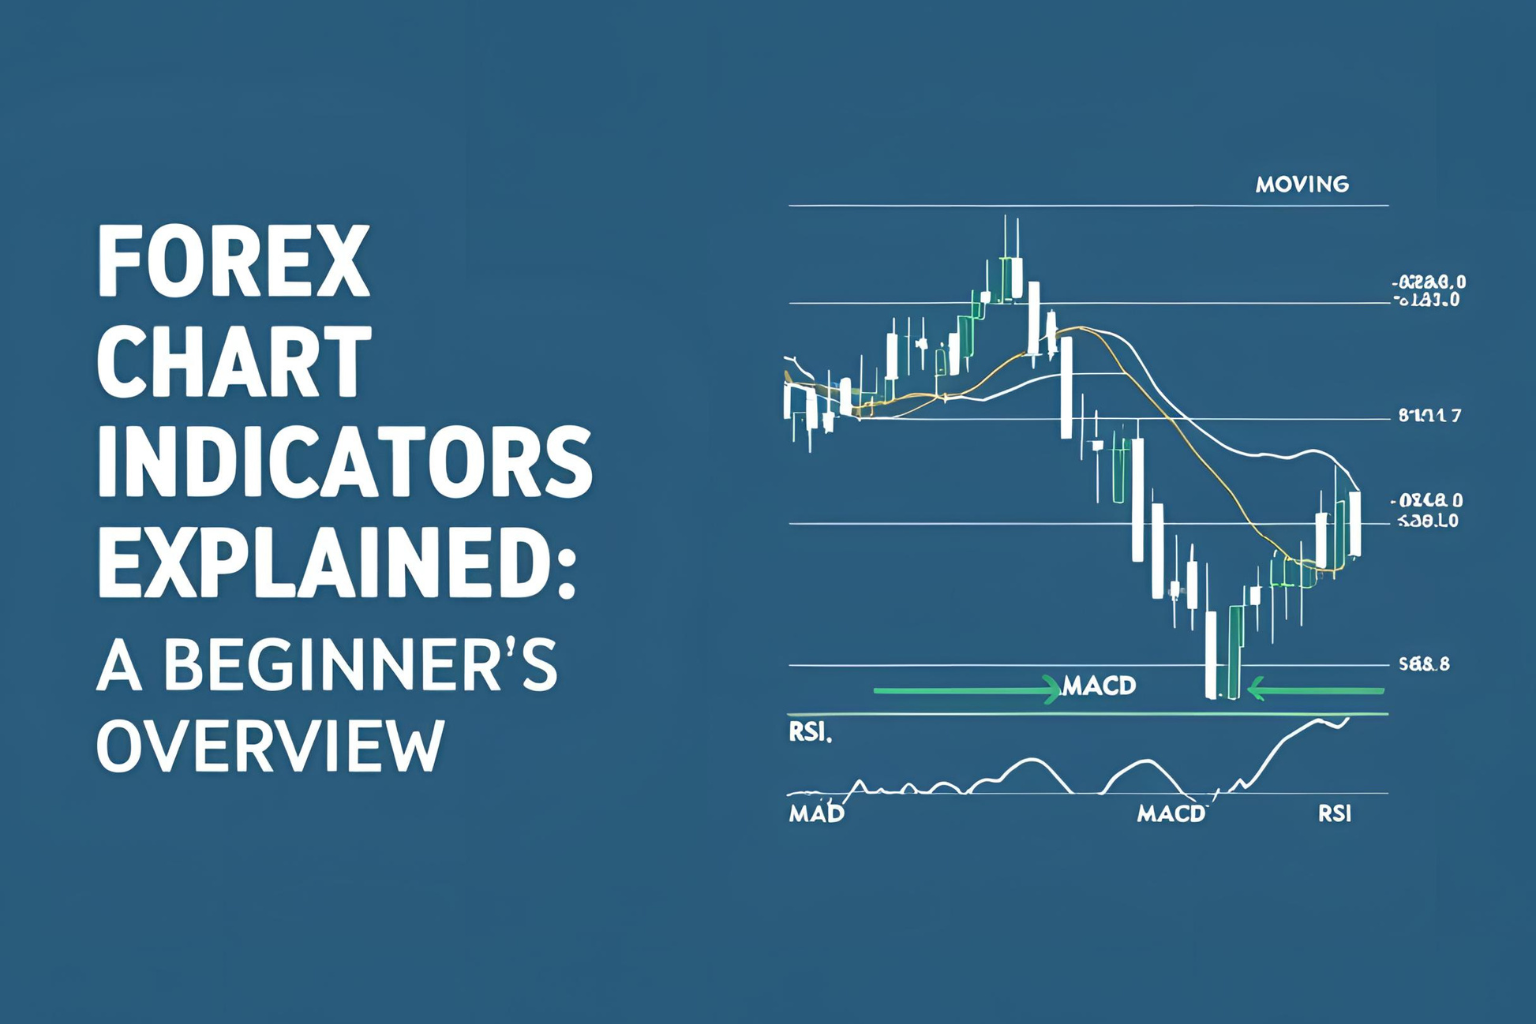
Forex Chart Indicators Explained: A Beginner’s Overview
Forex indicators are tools used by traders to analyze price movements, identify trends, and generate trade signals. While they’re not required to trade successfully, indicators can simplify decision-making — especially for beginners learning technical analysis.
This guide breaks down how indicators work and which ones are best for your forex charts.
What Are Forex Chart Indicators?
Indicators are mathematical calculations based on price, volume, or open interest. They appear on charts as overlays (on the price chart) or in separate panels below the chart.
They help answer questions like:
- Is the market trending or ranging?
- Is it overbought or oversold?
- When is a potential reversal likely?
Types of Forex Indicators
1. Trend Indicators
Show the direction and strength of a trend.
- Moving Averages (MA)
- MACD (Moving Average Convergence Divergence)
- Parabolic SAR
2. Momentum Indicators
Measure the speed of price movement.
- RSI (Relative Strength Index)
- Stochastic Oscillator
- CCI (Commodity Channel Index)
3. Volatility Indicators
Track how much price fluctuates.
- Bollinger Bands
- ATR (Average True Range)
4. Volume Indicators
Used mostly in stock trading, but some apply in forex.
- On-Balance Volume (OBV)
- Volume by Price (in TradingView)
How to Use Indicators Effectively
- Don’t overload your chart — Stick to 2–3 indicators maximum.
- Combine different types — e.g., trend + momentum.
- Use indicators for confirmation, not as the only basis for trades.
- Backtest setups before going live.
Example Setup for Beginners
- 50 EMA – to track the trend
- RSI – for overbought/oversold signals
- Bollinger Bands – for volatility-based entries
Do Indicators Work All the Time?
No indicator is perfect. They are best used as part of a broader strategy that includes:
- Price action
- Support/resistance levels
- Candlestick patterns
Final Thoughts
Indicators can give you clarity in fast-moving forex markets. Start with simple tools like Moving Averages and RSI, then expand your toolkit as you gain confidence. Always combine indicators with market structure and sound risk management.
FAQs
1. What’s the best indicator for beginners?
The Moving Average and RSI are widely used and easy to understand for new traders.
2. Can I trade using only indicators?
While possible, it’s best to combine indicators with price action for better accuracy.
3. How many indicators should I use?
Use 1–3 indicators max. Too many can create confusion and conflict.
4. Are indicators accurate for forex trading?
They’re helpful for spotting patterns and trends, but not 100% accurate. Always confirm with other tools.
5. What’s the difference between leading and lagging indicators?
Leading indicators try to predict future moves (e.g., RSI), while lagging indicators confirm trends after they start (e.g., MACD).